- Like
- SHARE
- Digg
- Del
- Tumblr
- VKontakte
- Flattr
- Buffer
- Love This
- Save
- Odnoklassniki
- Meneame
- Blogger
- Amazon
- Yahoo Mail
- Gmail
- AOL
- Newsvine
- HackerNews
- Evernote
- MySpace
- Mail.ru
- Viadeo
- Line
- Comments
- Yummly
- SMS
- Viber
- Telegram
- JOIN
- Skype
- Facebook Messenger
- Kakao
- LiveJournal
- Yammer
- Edgar
- Fintel
- Mix
- Instapaper
- Copy Link
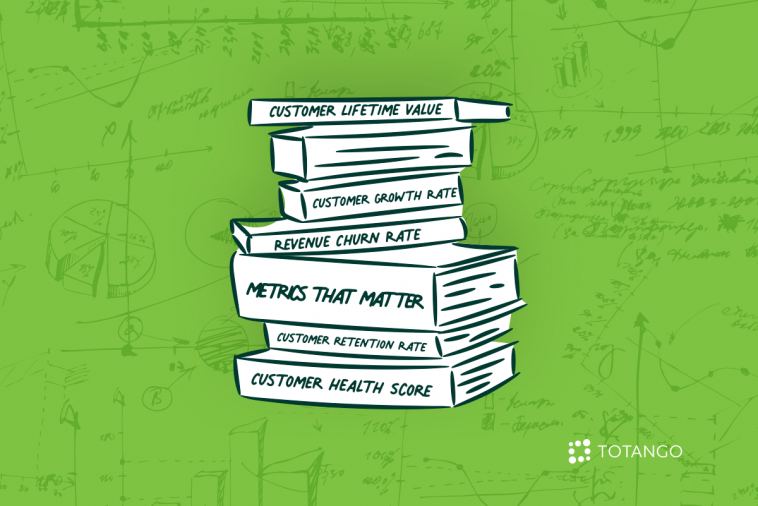
Customer retention is the keystone in any customer success strategy. There are many different types of customer retention metrics that one can track. Which customer retention metrics have the biggest impact on your business? Here are five of the most important ones and how to calculate them.
Customer Retention Rate
Your most fundamental key performance indicator for tracking and managing retention is your customer retention rate (CRR). This KPI tells you what percentage of customers are renewing their subscriptions with you over a given time frame, typically a year. Knowing this provides you with a baseline for evaluating your current retention performance and setting goals for improvement.
To track CRR, you can use the formula:
[(E-N)÷S] x 100 = CRR

To apply this formula, start by taking the number of customers you have at the end of the time frame you’re tracking (E) and subtracting any new customers you acquired during that period (N). Divide the difference by the number of customers you had at the start of the time frame (S). Multiply the result by 100 to convert to a percentage. The result is your customer retention rate.
Revenue Churn Rate
Revenue churn rate tracks how much of your revenue you retain each month. This can provide you insight into how much value your product provides customers. It can also reveal how downgrades and upgrades are contributing to revenue fluctuations.

Revenue churn rate can be calculated in a couple of different ways. Gross revenue retention (GRR) measures how much annual recurring revenue (ARR) you retain each month after you’ve subtracted loss from churn or downgrades, without factoring in increases due to upgrades from upsells or cross-sells. Net revenue retention (NRR) is similar, but factors in upgrades. GRR provides insight into how well you’re maintaining your existing revenue by getting customers to renew subscriptions, while NRR tells you how much your revenue is growing because of additional purchases by loyal customers.
The formula for GRR is:
GRR = [(ARR from renewals – ARR lost from churn – ARR lost from downgrades) / ARR at the beginning of the year] * 100
To apply this formula, take your annual recurring revenue from customers who renewed at the end of the month, subtract any revenue lost from lost customers or downgrades, and divide the resulting figure by your annual recurring revenue when the year started. Multiply by 100 to convert to a percentage.
The formula for NRR is similar:
NRR = [(ARR from renewals + ARR from upgrades – ARR lost due to churn – ARR lost due to downgrades) / ARR at the beginning of the year] * 100
You apply this the same way you would the formula for GRR, except you add MRR from upgrades before subtracting MRR lost from churn and downgrades.

Customer Health Score
Customer health score is an aggregate KPI that combines multiple metrics you have on your customer into an overall score which measures how much value the customer is getting from your product, how satisfied they are with your brand, how many support tickets they’ve submitted, how many times they’ve logged-in, how much time they’ve spent logged-in, and how likely they are to renew with you. Scores are color-coded. Green indicates that current customer engagement efforts are effective and should be continued. Yellow indicates that some green criteria are being met but there is room for improvement. Red indicates that something is wrong which requires urgent attention to avoid churn.
Because customer health score is a complex metric, calculating it involves an advanced algorithm. Totango SuccessBLOC modules such as Customer 360 and Voice of the Customer automatically compute customer health score for you and display it in user-friendly dashboard views and reports.
One important metric related to customer health score is Net Promoter Score (NPS). This tells you what percentage of your customers are likely to recommend you to others.
NPS is calculated by surveying customers, asking them to respond on a scale of 0 to 10 to a question such as, “How likely are you to recommend our brand to a friend or colleague?” Customers who answer 9 or 10 are extremely likely to recommend you and are classified as promoters. Those who answer 0 to 6 are not likely to recommend you. Answers of 7 or 8 are classified as passives and are factored out. Taking your percentage of promoters and subtracting your percentage of detractors yields NPS.
Customer Growth Rate
Customer growth rate sometimes refers to how fast your revenue for your entire customer base is growing per month, but it can also refer to how fast an individual customer’s use of your products is growing. This can be measured in terms of customer expansion metrics which track how much customers are using their current purchases and how much they’re spending on upsell purchases. For example, you can track license utilization or how often a customer is using a specific product feature, as well as whether they’ve responded to any upsell offers. These can be some of the best indicators of a customer’s intent to continue using your product. The Upsell and Expand Customers SuccessBLOC includes KPIs you can use to track customer growth.
Customer Lifetime Value
Customer lifetime value (CLV) tells you the average amount you can expect a customer to spend with you over the course of their relationship with you. This provides an important predictor of revenue, and taking steps to increase CLV can increase your revenue.
There are a number of methods you can use to calculate CLV. A simple method is to use the formula:
CLV = (Average order value) * (Number of orders/year) * (Average years/customer)
To apply this formula, take the average amount your customers spend per transaction, multiply by the number of transactions per year, and multiply by the average number of years you retain a customer. You can get the same result using a number of other variations on this formula, such as multiplying the average amount a customer spends per month by the average number of months they remain customers, for example. Totango’s Customer 360 SuccessBLOC lets you track the total contract value of all your accounts or segment it by individual customers or groups of customers.
Track Your Key Customer Retention Metrics to Keep More Clients
Top KPIs for managing retention include your retention and revenue churn rates, customer health score and growth rates and customer lifetime value. Monitoring these customer retention metrics provides the business intelligence you need to assess the effectiveness of your retention strategy, make adjustments and implement improvements.
Totango’s Spark customer success software provides SuccessBLOC modules that come out-of-the-box with all the KPIs you need to track your most vital retention metrics, as well as templates for implementing best practices to improve your numbers. Try it free to see how easy it can be to track and manage your most important retention metrics.